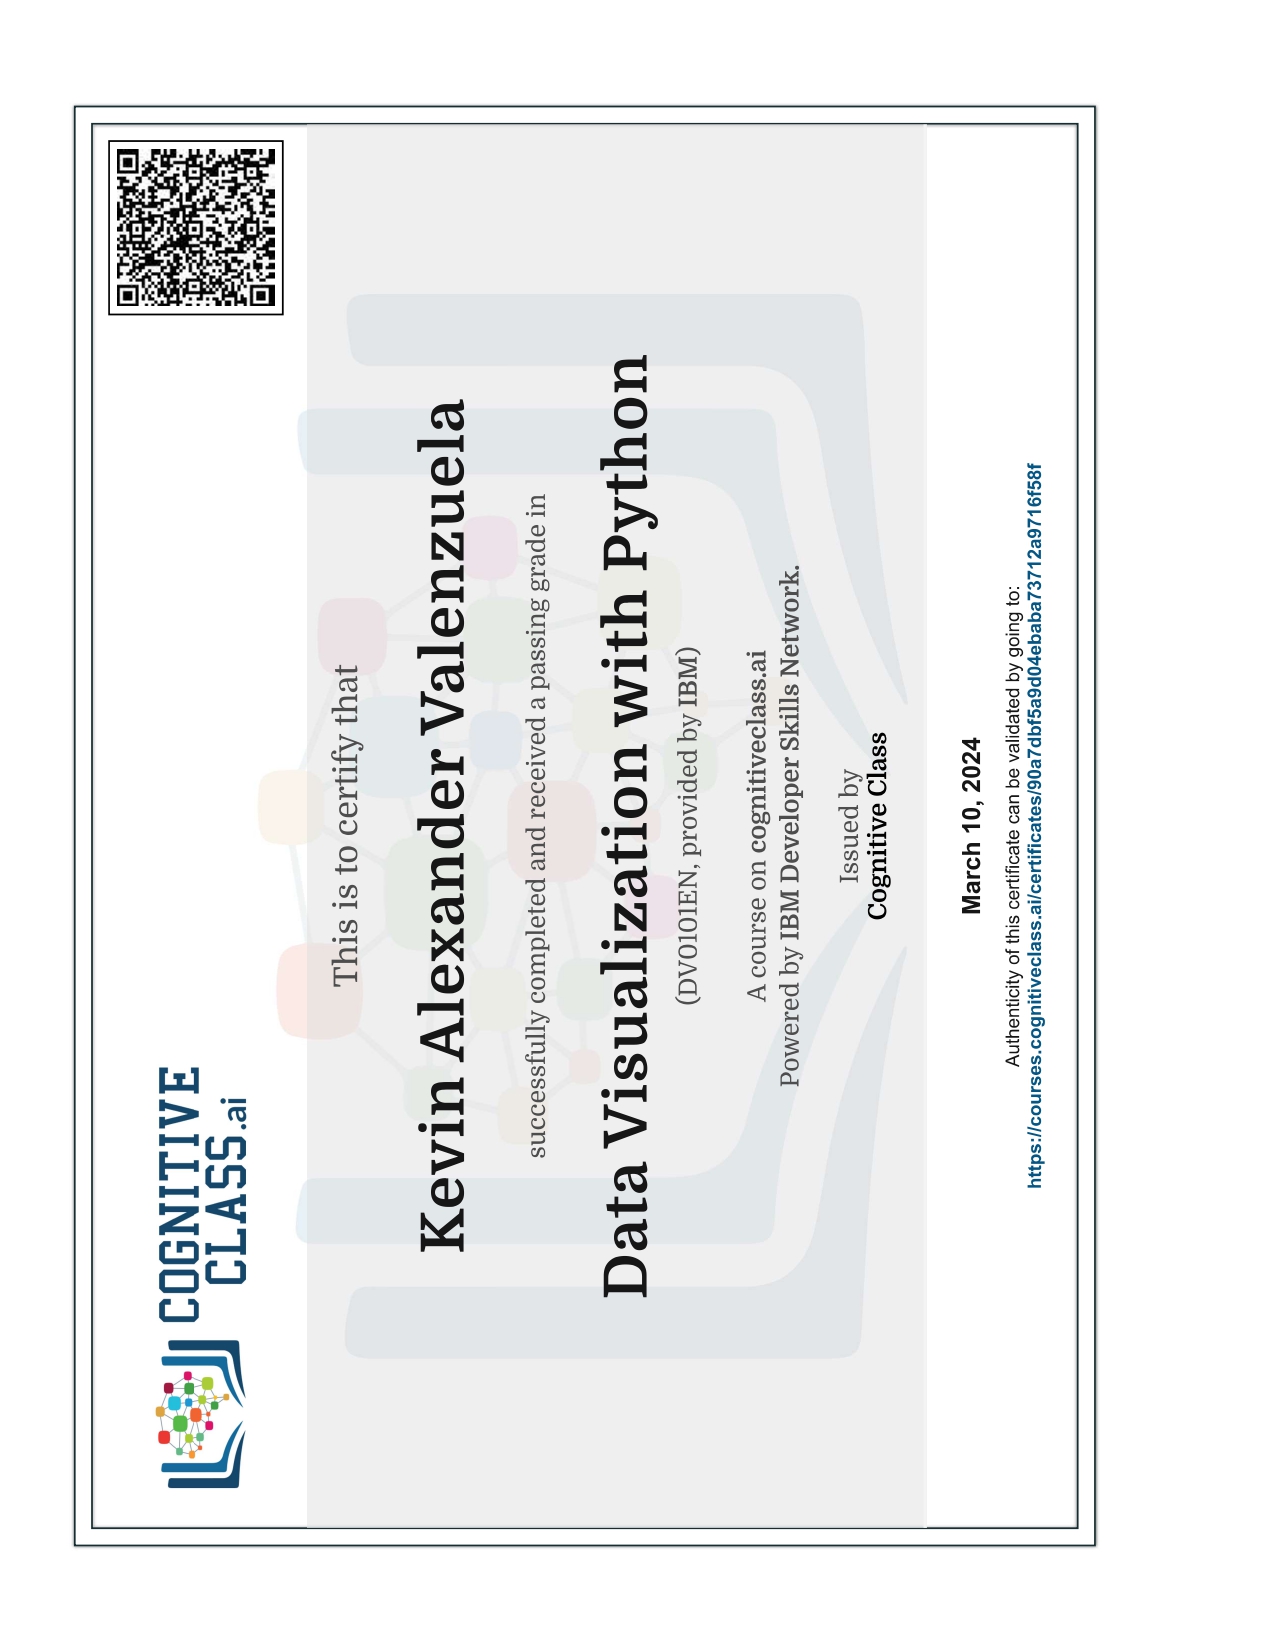
Data Visualization with Python
This course show me how to use python to visualize different types of data in in different plots. The plot created in this course were line plots, area plots, histograms, bar charts, pie charts, box plots, scatter plots, bubble plots, waffle charts, word clouds, and regression plots. Also the package Folium was used to create maps with markers and Choropleth Maps.

